Binary Options with Bollinger Bands
 Bollinger Band analysis is a tool for binary option analysis. It was created by and named after John Bollinger, a popular present-day technical investment analyst. Bollinger bands are normally plotted two standard deviations along with the simple moving average. Their aim is to show assets volatility with the help of their location; if the band is on its way away from the average, that shows the volatility of the market for this asset is increasing and if the band comes closer to the averages, that showes that volatile trend is decreasing.
How can you use volatility as a technical indicator for calls and puts when working with binary options? Volatility is usually associated with risk and treated like the measure of uncertainty about the range of security asset value changing. The higher volatility an anasset has, the higher is probability that the asset price will change very dramatically in a short time span upwards or downwards. If an asset has low volatility, that means its price will not greatly change and will remain steady over some short time period.
So, when purchasing binary options, a trader picks up a volatile asset and predict whether it will go up or down. And Bollinger Bands are very often the key technical chart to be used for this purpose.
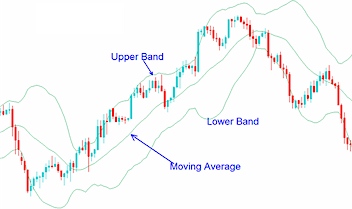
A great number of investors using Bollinger bands for prediction making believe that in the case when charted prices are located between the upper and middle Bollinger bands, the asset market will go upward. If otherwise: the asset price is between the lower and middle Bollinger band, this frequently indicates the market will keep falling.
How to understand from this information if to buy calls or on puts binary options? The biggest part of investors will definitely buy calls when the price is between the upper and middle Bollinger band and if it is trending down and nears the middle Bollinger line they will surely buy put options.
There is an idea that those bands are a great tool helping traders to capitalize on oversold conditions, spotting those asset prices going below the lower Bollinger band and after that having a trend to move back to the center Bollinger band. The investor who can predict this correction at the right time can earn a great profit.
But always keep in mind there is no sure thing to predict market trends but Bollinger bands are among the most popular technical tools which are used to predict an asset potential ultrashort term price changes.