Binary Options: Head and Shoulder Patterns
 When you first look at the stock market it will probably appear to be a huge mess of numbers, share prices climbing and falling without any obvious reason or any continuity. However, the only way to become a successful binary options trader is to analyse this data and find the underlying patterns. There will always be a pattern; it is these which experts use to predict whether the market is bullish or bearish, it helps them to decide what to invest and when. There are several key patterns which will help you understand the markets and binary trading better. The head and shoulder pattern is one of the most popular.
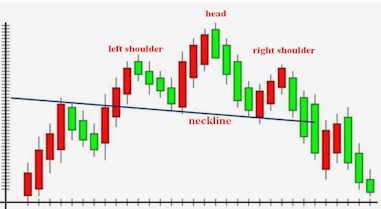
In fact, this pattern is named as such because it is almost exactly what you will see if you chart the price of an asset. The left shoulder is the starting price and will show as a fairly even price, possible with a slight dip. There will then be a steep climb in the price, this represents the head. The price will start to drop again until it reaches roughly the same level as before the spike. It will then continue, at a relatively level pace to represent the right shoulder.
The ideal time to invest in this pattern is at the bottom of the spike; you can make a quick return as the head is formed. However, it is difficult to spot the pattern at this stage, unless there has been a regular recurrence of it. Instead, you need to focus on when the price starts to drop. It is generally safe to assume that the price will drop to roughly the same level as it was at the start of the movement (the left shoulder). When it reaches this point it is usually seen as the best time to enter the market. You can then benefit from the slight incline which represents the curve of the shoulder, or taking a slightly longer view and wait for it to reach the top of the head again. The start of the right shoulder ends one pattern but can also be seen as the start of the next one.
The secondary factor which must be considered is the time frame. As you are looking for a pattern it should be roughly the same each time. Therefore, the time the price took to go from the start of the left shoulder to the top of the head, should be approximately the same amount of time you should invest for.
It can also be beneficial to look at the neckline of your chosen asset. You will often see a break in it as the new price is set due to people testing whether to invest or not. This is seen as a good time to use a put option; you should see a good rate of return on your investment. It is worth noting that, although this is usually visible, sometimes it doesn’t; this can mean you lose out on what could have been a good trade, but, you will learn more about the market patterns whilst watching.
The last piece of this pattern involves looking at the head. The pattern should appear regularly in the history of the asset, assuming it does you should be able to predict the next time it will be at the bottom of the head. Historical analysis can also give you an idea as to how much the price will rise; i.e. where the top of the head is. This should give you the confidence to enter the market at the bottom of the head with a prediction of the price it should reach and complete a secondary trade entering at the top with the assumption that it will level out on the right shoulder. This approach can be very successful and the risks can be balanced against each other.